Introduction to eBPF
 Valery Brasseur
- 7 Min To Read
- 12 Aug, 2025
eBPF , or Extended Berkeley Packet Filter, is a powerful and flexible technology in the Linux kernel that allows user-defined programs to execute safely and efficiently. Originally developed for filtering network packets, eBPF has evolved into a versatile tool used for network monitoring, performance analysis, and security enforcement. Today, it enables safe and efficient kernel extension without requiring changes to the kernel source code or loading kernel modules. Some well-known users include Netflix, Google, Android, and Cloudflare. The name comes from BPF, which originally stood for Berkeley Packet Filter. However, since eBPF (extended BPF) now does much more than packet filtering, the acronym no longer fully describes its capabilities. eBPF is now considered a standalone term that does not stand for anything specific.
Key Features of eBPF
Several features make eBPF particularly interesting for low-level and security programming:
- Safety: Each eBPF program is verified before execution to ensure it cannot crash the OS.
- Performance: eBPF programs run in kernel space, in a high-performance VM optimized for the CPU.
- Flexibility: There are many hooks (with a growing number) that can be used to attach actions and events.
Common Use Cases
- Network Monitoring and Filtering: eBPF can inspect and filter network packets, enabling advanced networking features such as load balancing, firewall functionality, and traffic shaping.
- Performance Monitoring: Tools like
bpftraceandperfuse eBPF to dynamically insert probes and collect performance data. - Security: eBPF can enforce security policies, detect anomalies, and respond to suspicious activities. For example, it can monitor system calls to ensure compliance with security policies, as seen in applications like SentinelOne .
- Tracing and Debugging: eBPF can trace various kernel and user-space events, helping to better understand the inner workings of workloads.
How eBPF Works
eBPF enables userspace applications to package logic that can be executed within the Linux kernel as bytecode. eBPF programs are invoked by the kernel when certain events, called hooks, occur. Examples of such hooks include system calls, network events, and more.
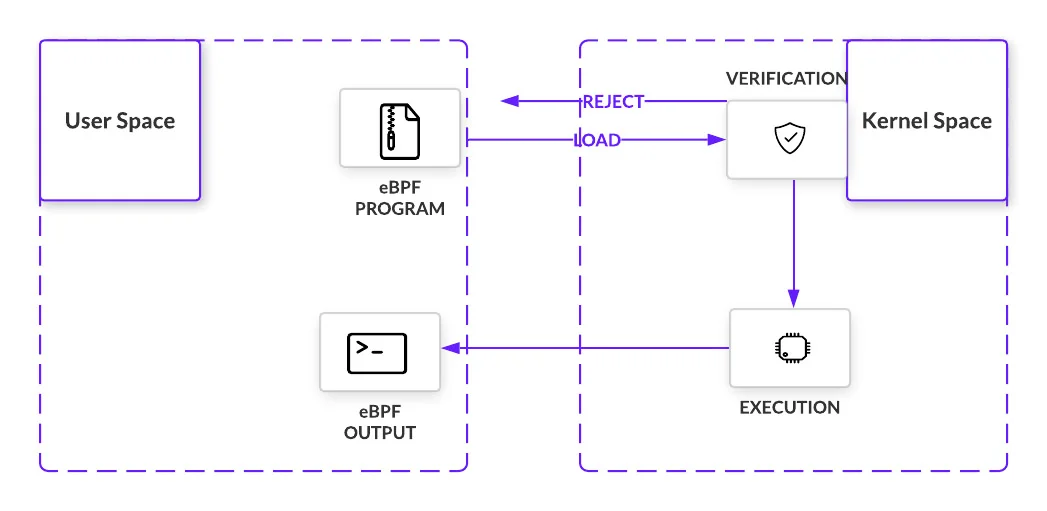
Before execution, a verifier traverses the potential paths an eBPF program may take within the kernel, ensuring it can run to completion without entering an infinite loop, which could cause a kernel lockup. From the outset, eBPF distinguishes itself from Loadable Kernel Modules (LKMs) by implementing important safety controls. For example, while some security measures (like those employed by CrowdStrike) may be difficult to implement without these protections, similar functionality can be developed using eBPF. Only if all checks pass is the eBPF program loaded, compiled into the kernel, and set to wait for the appropriate hook. Once triggered, the bytecode executes.
eBPF programs execute in an event-driven environment and are triggered by kernel hooks. The diversity of hook locations is one of the many aspects that makes eBPF so useful. A quick sampling of these includes:
- System Calls: Inserted when user space functions transfer execution to the kernel.
- Function Entry and Exit: Intercepts calls to pre-existing functions.
- Network Events: Executes when packets are received.
- Kprobes and Uprobes: Attach to probes for kernel or user functions.
When eBPF programs are activated at their respective hook points, they can call helper functions. These special functions are what make eBPF feature-rich. These helper functions must be defined by the kernel, meaning there is a whitelist of calls eBPF programs can make.
eBPF maps allow programs to maintain state between invocations and share data with userspace applications. An eBPF map is essentially a key-value store, where values are generally treated as binary blobs of arbitrary data.
The execution of eBPF programs utilizes modern Just-In-Time (JIT) compilation, which closely maps eBPF bytecode to the underlying hardware for x86_64, ARM, and arm64 architectures.

Getting Started
To start working with eBPF, you’ll need a recent Linux kernel (version 4.9 or newer) and typically some familiarity with C programming. In many scenarios, eBPF is not used directly but rather through projects like Cilium , bcc , or bpftrace , which provide an abstraction on top of eBPF. These projects do not require you to write eBPF programs directly; instead, they allow you to specify intent-based definitions that are implemented using eBPF. The Linux kernel expects eBPF programs to be loaded as bytecode, and a verification step ensures that the program is safe to run.

But before diving into a small example, let’s briefly examine how eBPF works.
Tools
- BCC: BCC is a framework that enables users to write Python scripts with eBPF programs embedded inside them. Running the Python code generates eBPF bytecode and loads it into the kernel. This is a very easy way to collect statistics, events, and more, and display them in a human-readable way.
- bpftrace: A high-level language largely inspired by C and awk, used to interact with the kernel and extend its tracing capabilities. You can think of it as a successor to dtrace.
- Others: Similar to BCC, there is a Go library that helps write Go programs interacting with the kernel, as well as libbpf, which is very generic.
A Simple “Hello World”-like Filter
Let’s see how to use BCC to write a simple TCP tool that shows session information (you can find it in the full BCC distribution, such as this tcpv4connect.py example ).
1. Define the eBPF program
Since we are using Python, we will store our eBPF program in a string. The eBPF code is C-like and requires some header inclusions to start.
We will use a hashmap (BPF_HASH) to store our socket data. The most interesting parts are the two probes: kprobe__tcp_v4_connect and kretprobe__tcp_v4_connect, which are called during the socket lifecycle and allow us to collect the necessary information for display using bpf_trace_printk.
#include <uapi/linux/ptrace.h>
#include <net/sock.h>
#include <bcc/proto.h>

BPF_HASH(currsock, u32, struct sock *);

int kprobe__tcp_v4_connect(struct pt_regs *ctx, struct sock *sk)
{
  u32 pid = bpf_get_current_pid_tgid();
  return 0;
};

int kretprobe__tcp_v4_connect(struct pt_regs *ctx)
{
 int ret = PT_REGS_RC(ctx);
 u32 pid = bpf_get_current_pid_tgid();

 struct sock **skpp;
 skpp = currsock.lookup(&pid);
 if (skpp == 0) {
  return 0; // missed entry
 }

 if (ret != 0) {
  currsock.delete(&pid);
  return 0;
 }

 // pull in details
 struct sock *skp = *skpp;
 u32 saddr = skp->__sk_common.skc_rcv_saddr;
 u32 daddr = skp->__sk_common.skc_daddr;
 u16 dport = skp->__sk_common.skc_dport;

 // output
 bpf_trace_printk("trace_tcp4connect %x %x %d\\n", saddr, daddr, ntohs(dport));

 currsock.delete(&pid);

 return 0;
}
2. Initialize eBPF
Now, using our string variable, we can initialize the eBPF kernel from Python:
b = BPF(text=bpf_text)
3. Filter and format output
Using the above eBPF instance, we can gather the data to display:
while 1:
    # Read messages from kernel pipe
    try:
        (task, pid, cpu, flags, ts, msg) = b.trace_fields()
        (_tag, saddr_hs, daddr_hs, dport_s) = msg.split(b" ")
    except ValueError:

        # Ignore messages from other tracers
        continue
    except KeyboardInterrupt:
        exit()

    # Ignore messages from other tracers
    if _tag.decode() != "trace_tcp4connect":
        continue
To run this on an OS such as RHEL8 (Red Hat Enterprise Linux 8), you must first install the packages for Python, bcc, and eBPF tools as follows:
sudo yum install -y bcc bcc-tools python3-bcc
Then, you can run your script, which will display the PID, command name, source address, destination address, and destination port of each established TCP connection.
sudo python3 ./tcpconnect.py
PID    COMM         SADDR            DADDR            DPORT
689185 haproxy      10.200.43.87     10.200.43.48     9080
689185 haproxy      10.200.43.87     10.200.43.48     9080
689188 haproxy      10.200.43.87     10.200.43.48     9080
sudo is required to allow the eBPF program to attach to kernel functions and access network data.
Conclusion
eBPF represents a groundbreaking evolution in Linux kernel technology, transforming how developers interact with the kernel and extend its functionality without the risks typically associated with traditional kernel programming methods. It is a formidable tool for various applications, including tracing or auditing SSH connections, counting random or sequential disk I/O, and gathering statistics on TCP connections.
Links & References
- eBPF : The official site
- Cilium : An open-source project that uses eBPF to provide high-performance networking, security, and observability for containerized applications, particularly in Kubernetes environments.
- bcc : A toolkit for writing eBPF programs in C and Python, used for efficient kernel tracing and performance analysis.
- bpftrace : A high-level tracing language for eBPF, allowing users to write concise scripts for tracing kernel and user-space events.
- “BPF Performance Tools” by Brendan Gregg: A comprehensive guide covering eBPF and its use in performance analysis.
- O’Reilly Learning eBPF by Liz Rice