
Diagram As Code
 Valery Brasseur
- 8 Min To Read
- 25 Jul, 2023
Diagram as Code (DaC) is a methodology that allows you to create and maintain software architecture diagrams using code. With DaC, you can define the structure of your application in a declarative way, using a domain-specific language (DSL) or a programming language, and generate diagrams from that code automatically. This approach has many benefits over manual diagramming, such as improved consistency, better maintainability, and increased automation.
Using DaC, you can create a wide range of diagrams, including flowcharts, UML diagrams, network diagrams, and more. You can also use different tools and frameworks to generate diagrams from your code, such as Graphviz, PlantUML, and Mermaid.
One of the main advantages of DaC is that it allows you to keep your diagrams in sync with your code. As your application evolves, you can update your code to reflect the changes in the architecture, and the diagrams will be automatically updated as well. This eliminates the need for manual diagramming, which can be error-prone and time-consuming.
Another benefit of DaC is that it allows you to collaborate more effectively with your team. By sharing code instead of diagrams, you can easily discuss and review changes to the architecture, and everyone can work from the same source of truth.
Moreover if the diagram is alongside the code, we are more likely to edit them than if they are lost somewhere in Confluence. Besides, one line of code is often all you need to add any element, so no excuse for not having the time to update the diagram. Finally, a diagram created as code is clean and consistent
On open-source there is 2 contenders on this:
- Diagrams : more for Architecture diagrams
- Kroki provides a unified API with support for most of the diagram you ever wanted!
Diagrams
Diagrams is an open-source diagramming tool originally writen in Python, that allows users to create various types of diagrams, such as flowcharts, network diagrams, using a simple and intuitive syntax. The tool is built on top of Python and Graphviz, and generates high-quality diagram images that can be used in documentation, presentations, and other applications.
One of the main advantages of diagrams is its ease of use and flexibility. Users can create complex diagrams using a simple syntax, and can easily customize the appearance and layout of the diagrams using various styling options. The tool also offers a range of customization options, such as support for custom shapes and styles, and can be extended with plugins and custom code.
Diagrams lets you draw the cloud system architecture in Python code. Diagram as Code allows you to track the architecture diagram changes in any version control system. Diagrams currently supports main major providers including: AWS, Azure, GCP, Kubernetes, Alibaba Cloud, Oracle Cloud, etc. It also supports On-Premise nodes, SaaS and major Programming frameworks and languages.
Kroki
Kroki is an open-source tool that allows users to easily create diagrams and charts using plain text syntax. The tool supports various diagram types, such as flowcharts, sequence diagrams, UML diagrams, and many others.
Kroki works by interpreting plain text diagrams written in various markup languages, such as Mermaid, PlantUML, Graphviz, and others. Users can create diagrams by writing the diagram syntax in a plain text editor and then passing the text to the Kroki service, which generates the corresponding diagram as an image file.
Kroki is also highly customizable, as users can choose from various styles and themes to customize the look and feel of their diagrams. Additionally, because Kroki is open source, users can contribute to the development of the tool and add new features or diagram types.
Usage
Kroki example
Kroki can be use in two modes:
- self manage: you install it on your own infrastructure
- free service: using the free available Kroki server from the project
Here’s an example of how Kroki can be used to create a simple BlockDiagram:
blockdiag {
  Kroki -> generates -> "Block diagrams";
  Kroki -> is -> "very easy!";

  Kroki [color = "greenyellow"];
  "Block diagrams" [color = "pink"];
  "very easy!" [color = "orange"];
}
Using the free service you can then call Kroki server, and then pass this syntax to Kroki, which will generate an image for you which you can save as a PNG or SVG file and use in your project documentation or presentations.
https://kroki.io/blockdiag/svg/eNpdzDEKQjEQhOHeU4zpPYFoYesRxGJ9bwghMSsbUYJ4d10UCZbDfPynolOek0Q8FsDeNCestoisNLmy-Qg7R3Blcm5hPcr0ITdaB6X15fv-_YdJixo2CNHI2lmK3sPRA__RwV5SzV80ZAegJjXSyfMFptc71w==
Here is some of what can Kroki do:

How to install Kroki
To install Kroki on your own server, you will need to get one (ore some more for additionnal functionalities) docker images.
Before starting the server, you will be able to customize some settings. For more information, go to Kroki installation
Diagrams
Diagrams is built on top of Python and Graphviz, So it requires Python 3.6 or higher, and you need to install Graphviz to use diagrams.
After that, you can use pip or other to install it :
# using pip (pip3)
$ pip install diagrams

# using pipenv
$ pipenv install diagrams
now in your preferd python editor you can wrote some code to generate your daigram :
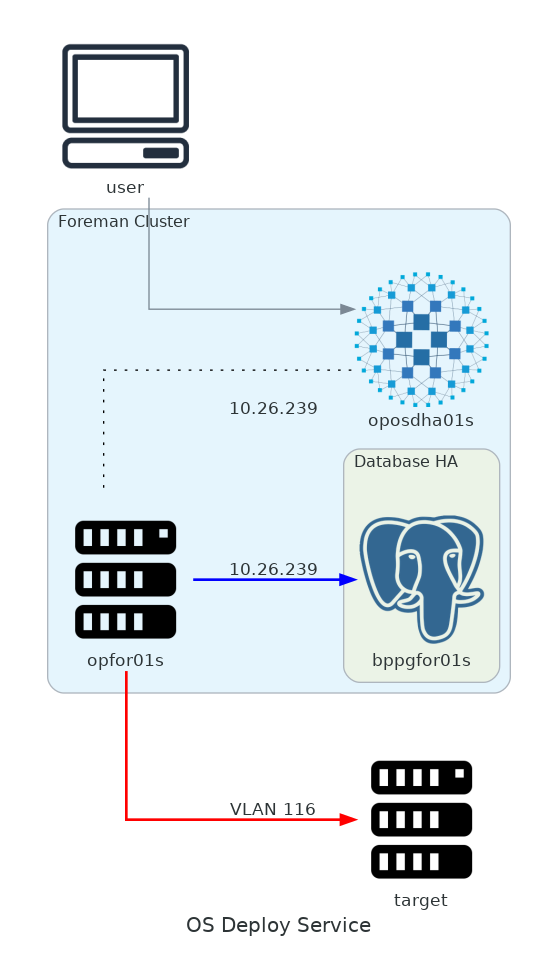
# diagramming osdeploy

from diagrams import Cluster, Diagram, Node, Edge
from diagrams.onprem.compute import Server
from diagrams.onprem.database import PostgreSQL
from diagrams.aws.compute import ECS
from diagrams.onprem.monitoring import Grafana
from diagrams.generic.virtualization import Vmware
from diagrams.onprem.client import Client
from diagrams.onprem.compute import Server
from diagrams.onprem.logging import Rsyslog
from diagrams.onprem.monitoring import Zabbix
from diagrams.onprem.network import Haproxy

graph_attr = {
    "fontsize": "45",
    "bgcolor": "transparent"
}

with Diagram(name="OS Deploy Service", show=False):
    user = Client("user")
    target = Server("target")

    with Cluster("Foreman Cluster"):

        opfor01s = Server("opfor01s")
        oposdha01s = Haproxy("oposdha01s")
        opfor01s - Edge(label="10.26.239", color="black", style="dotted") - oposdha01s

        with Cluster("Database HA"):
            primary = PostgreSQL("bppgfor01s")

    opfor01s >> Edge(label="10.26.239", color="blue" , style="bold") >> primary
    user >> oposdha01s

    opfor01s >> Edge(label="VLAN 116", color="red" , style="bold") >> target
running it will generate a nice png file.
How to use it in a Gitlab pipeline
To use Diagrams in a GitLab pipeline you will need to add the necessary commands and scripts to your pipeline configuration file.Here is an example configuration that demonstrates how to generate a diagram and include it as an artifact in your pipeline:
stages:
  - build
  - test

generate_diagram:
  stage: build
  image: python:3.9
  script:
    - pip install diagrams
    - python generate_diagram.py
    - mv diagram.png diagram-$CI_COMMIT_SHA.png

  artifacts:
    paths:
      - diagram-*.png
  when: always
In this example, the pipeline consists of a single job (generate_diagram) that runs in the build stage.The job uses the python:3.9 Docker image, installs the diagrams package using pip, and runs a Python script (generate_diagram.py) that generates a diagram using diagrams.mingrammer.com.
After the diagram is generated, the job renames the diagram file to include the Git commit SHA and saves it as an artifact. The when: always directive ensures that the artifact is saved even if the job fails.
You will need to customize the configuration file to match your specific needs and requirements. Make sure to replace generate_diagram.py with the name of your Python script that generates the diagram, and adjust the artifact paths and naming conventions as needed.
Once you have created and committed the .gitlab-ci.yml file, GitLab will automatically run the pipeline and execute the generate_diagram job. You can then access the generated diagram artifact in the pipeline job page or in the GitLab artifacts browser.
Create a diagram from Terraform ?
It is possible to use diagrams.mingrammer.com to create diagrams from Terraform code.You can write a Python script that parses your Terraform configuration files and generates a diagram based on the resources and dependencies defined in your code.
Here is an example script that generates a diagram of the resources and dependencies in a Terraform configuration file:
import os
from diagrams import Diagram, Cluster
from diagrams.onprem.compute import Server
from diagrams.onprem.database import PostgreSQL
from python_terraform import Terraform

def get_resources(tfstate):
    resources = {}
    for r in tfstate['resources']:
        if r['type'] == 'aws_instance':
            resources[r['name']] = Server(r['name'])
        elif r['type'] == 'aws_db_instance':
            resources[r['name']] = PostgreSQL(r['name'])
    return resources

def get_dependencies(tfstate, resources):
    dependencies = []
    for r in tfstate['resources']:
        if 'depends_on' in r['instances'][0]:
            for dep in r['instances'][0]['depends_on']:
                if dep in resources:
                    dependencies.append((resources[dep], resources[r['name']]))
    return dependencies


def generate_diagram():
    tf = Terraform(working_dir='./terraform')
    tfstate = tf.state(show='json')
    resources = get_resources(tfstate)
    dependencies = get_dependencies(tfstate, resources)
    with Diagram('Terraform Resources', show=False):
        with Cluster('Resources'):
            for resource in resources.values():
                resource
        for dep in dependencies:
            dep[0] >> dep[1]

if __name__ == '__main__':
    generate_diagram()
In this example, the script uses the Terraform library to read the state of a Terraform configuration stored in the ./terraform directory. It then extracts the resources and dependencies defined in the configuration and generates a diagram.
Finally, you can run the script using the Python interpreter:
python generate_diagram.py
This will generate a diagram image file in the current directory based on the resources and dependencies in your Terraform configuration.
Conclusion
By utilizing these tools, you can effortlessly keep your diagram in sync with the progress of your application and documentation, ensuring that you remain up-to-date. Furthermore, you have the flexibility to apply the same workflow and methodology as your developers, streamlining the entire process. Kroki will be more flexible and comprehensive, but it requires hosting a server, whereas Diagrams will be closer to a developer’s usage.
Links: