Applications debugging using Flame Graphs
When we face bugs or performance issues in production we have to worry about how we can make a good analysis without worsering the situation. Reproducing a problem in staging or in a development environment is a real challenge. And debugging tools are often not so easy to use in production without making a huge impact on applications.
Linux developers have made a special effort in recent years to provide indicators for profiling system ressource usage such as CPU or memory with a very low overhead on the system. Brendan Gregg has developed a visualization technique called Flame Graphs for charting these metrics.
A common approach for CPU profiling is the sampling of stack traces. perf is an amazing tool for observing and capturing system performance metrics.
The generation of Flame Graphs depends on perf capturing call frames.
# perf record -F 99 -a -g -- sleep 60
This produces a raw data file.
The call frames we need are there.
We just have to process this data with a reporting tool.
# perf script | ./stackcollapse-perf.pl | ./flamegraph.pl > perf.svg
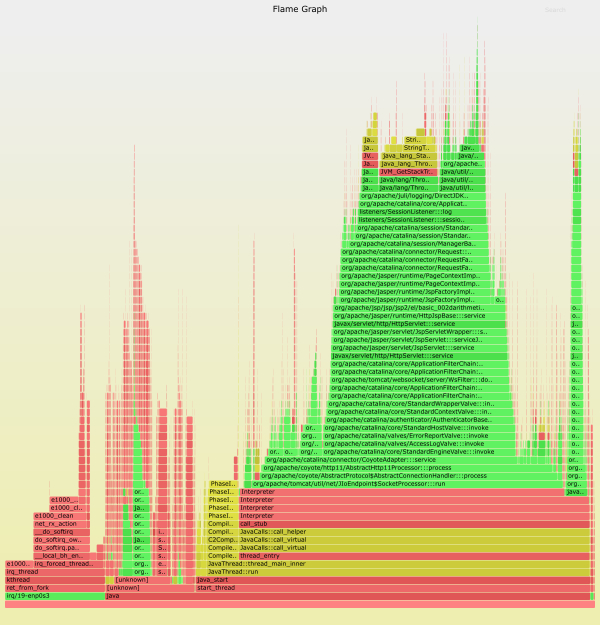
A flame graph represents a collection of stack traces (or call stacks) shown as a flame or inverted icicle layout.
A stack trace is organized in columns which contain a superposition of boxes; each box is a function (i.e. call/stack frame):
- The y-axis is the stack depth. The top box shows the call frame that was on-CPU when the stack was captured and every box below represents the ancestry.
- The x-axis does not really show the flow of time. The left to right reading has no special meaning because boxes are ordered alphabetically. Identical adjacent functions are merged.
- The box width represents the frequency at which the function was found in the capture (including ancestry). Wide boxes were more present than narrow boxes.
Brendan Gregg tools create a Scalable Vector Graphic (SVG) with embedded JavaScript that supports interactivity to ease the navigation:
- Mouse-over on a box shows a tooltip that displays number of calls for this function
- The flame zooms horizontally when you click on a box
- Search, which support s regular expressions, shows a highlight of terms in the graph
While examining the graph you can visually trace function calls with ancestry and identify where CPU is consumed and detect abnormal behavior.
But it’s not always possible to generate the graph especially for applications that don’t export function names in stack traces. gcc can reuse the frames pointer as an optimization making profiling back impossible. In this case, if you capture stack traces, you will not see function names nor the ancestry.
For example, Java is typically compiled with this limitation. Brendan has developed a patch in OpenJDK to avoid this limitation. The patch was accepted and also introduced in Oracle JDK starting from version 1.8.0u60.
It introduces a new option:
XX:+PreserveFramePointer
The patch is only available in JDK not in JRE.

Keep in mind that Netflix tests show an extra cost of CPU between 0 and 3% depending on workload. Using kernel profilers give us the possibility to show CPU time spent in Java methods and interaction between Java, system librairies and kernel. Dedicated Java profilers like jmaps are limited to the JVM and can’t see what happens outside.
Conclusion:
Flame Graphs is really an amazing technique to faithfully visualize applications’ behavior directly in production with a minimum impact on client services. We now have a new string to our bow helping us to ensure our services quality insurance.
